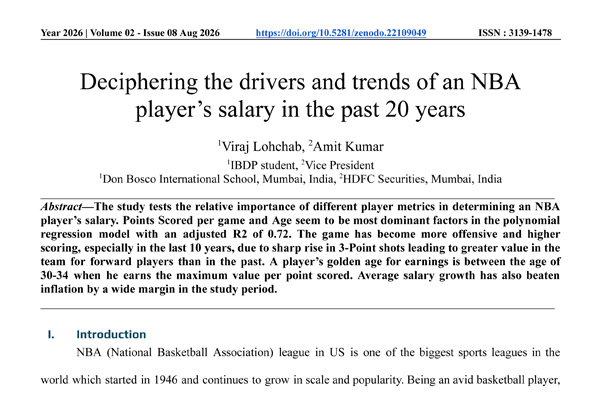
1 : Deciphering the Drivers and Trends of an NBA Player’s Salary in the Past 20 Years

  • Publication Status : Peer-Reviewed, Published (Lead Author). International Innovations & Scholarly Trends Journal, 2(8), 443-458, ISSN: 3139-1478, 2026.
  • Contributing Authors : Viraj Lohchab, Amit Kumar. My role involved analysing historical data, identifying key variables and developing regression models. My co-author, helped with preparing and organizing the large data set in excel to help run the analysis and guided me on how to present key findings.
  • Core Methodology : Ordinary Least Squares (OLS) Estimation, Multi-variable Linear & Polynomial Regression, Paired Sample Mean t-tests.
  • Dataset Size : 8,798 unique player rows across 26 variables.
  • Digital Object Identifier (DOI) : https://doi.org/10.5281/zenodo.22109049


Abstract

The study tests the relative importance of different player metrics in determining an NBA player’s salary. Using each year’s data across 2006-2025 of every league athlete, a dataset comprising 8,798 unique player rows and 26 distinct variables was compiled. Multi-variable linear and polynomial regression models were constructed using Ordinary Least Squares (OLS) estimation after checking for multicollinearity. Points Scored per game and Age turned out to be the most dominant factors in the polynomial regression model which had the highest adjusted R² of 0.72. Game’s evolution and salary trends were also analysed from perspective of a player’s playing position and his lifecycle. Over the study period, an NBA game has clearly turned more offensive and higher scoring due to sharp rise in 3-Point shots leading to greater value in the team for forward players. A player’s golden age for earning is between the age of 30-34 when he earns the maximum value per point scored. Average player salary growth has also beaten inflation by a wide margin in the study period.


Key Analytical Conclusions

  • The Suppressor Variable Paradox : While Age (AGE) shows low isolated correlation with salary, it acts as a vital suppressor variable of conditional significance. Factoring AGE into a multi-variable polynomial regression model jumps the predictive explanatory power from an Adjusted R² of 0.56 to 0.72.
  • The Micro-Macro Incentives Gap : The individual labor market exclusively optimizes for volume—Points Per Game (PTS)—over efficiency. While physical productivity (PTS) usually peaks at age 30, individual earnings per point (Salary/PTS) continue rising 3x from rookie baselines to peak between ages 30–34, proving that brand equity functions as a lagging indicator in contract valuation models.
  • • Macro Market Trajectory : Average player compensation outpaced US inflation benchmarks (2.5%) by doubling from $4.1M to $9.6M over 20 years (5.1% CAGR), heavily accelerating to a 10% CAGR over the last decade due to pick-up in pace of the game and league’s revenue profile post-2015.

2 : The Winning Formula for an NBA Team

  • Publication Status : Peer-Reviewed, Published. International Journal for Multidisciplinary Research, Volume 8, Issue 5, E-ISSN: 2582-2160
  • Contributing Authors : Viraj Lohchab (Independent author, guided by Maths teacher, Ms. Teena Ohri)
  • Core Methodology : Multi-variable Linear & Predictive OLS Regression, Volatility Analysis, Efficiency Modeling.
  • Dataset Size : 600 unique team-season observations across 25 variables.
  • Digital Object Identifier (DOI) : https://doi.org/10.36948/ijfmr.2026.v08i05.89353


Abstract

This study identifies the critical game statistics that determine the regular-season win-loss percentage of National Basketball Association (NBA) teams. Utilizing box-score statistics from the past 20 years, a dataset comprising 600 team-season observations and 25 distinct variables was compiled. Multiple linear regression models were constructed using Ordinary Least Squares (OLS) estimation to evaluate predictive power and forecasting accuracy. In the concurrent descriptive model, point differential (PD), effective field goal percentage (eFG%), and turnover percentage (TO%) emerged as the most critical statistics, accurately explaining team performance (Adjusted R² > 0.92). However, predictive accuracy dropped significantly when forecasting a team’s future win-loss percentage using prior-season data (Adjusted R² = 0.44), with a substantially higher standard error. This inherent predictive volatility underscores the league's competitive balance, contributing to rising viewership, escalating league revenues, and growing team payrolls over the past decade. Finally, individual historical team performance trends are evaluated alongside a novel 'Return on Salary' metric, revealing diminishing value of salary as a variable to improve team performance.


Key Analytical Conclusions

  • The Forecasting Volatility Gap : While concurrent in-season team performance is highly transparent—where combining Point Differential (PD), Effective Field Goal Percentage (eFG%), and Turnover Percentage (TO%) yields an Adjusted R² of 0.92 with a standard error of 0.03—next-season predictive modeling drops sharply to an Adjusted R² of 0.44 with a standard error of 0.11.
  • Systemic Equilibrium : This low predictability across seasons acts as the core economic driver of the league, creating the competitive parity that sustained a 7.6% revenue CAGR over 20 years. Team performance variations or inconsistencies have increased in the last 5 years.
  • Capital Efficiency Modeling : The study engineered the Return on Salary (RoS) metric (Win-Loss%/ Salary Bill) to map spending efficiency. The results show that despite payroll outlays increasing at a 10% CAGR over the last five years, top-tier financial outlays do not guarantee performance market share, proving diminishing returns on capital.

3 : The Pursuit of Profit Maximisation (Literature review)

  • Publication Status : Peer-Reviewed, Published. International Innovations & Scholarly Trends Journal, 2(9), 321-331, ISSN: 3139-1478, 2026.
  • Contributing Authors : Viraj Lohchab (Independent author, guided by Economics teacher, Ms. Aarti Malik)
  • Core Methodology : Conducted a comprehensive literature review analyzing over 40 popularly cited economic papers in the subject area presenting arguments from both sides. Evaluated long-term metrics of wealth distribution, market incentives, and state-led resource allocation to understand key drivers of societal development.
  • Digital Object Identifier (DOI) : https://doi.org/10.5281/zenodo.22805956


Abstract

The literature review paper highlights the impact on socio-economic development parameters under different economic models (Capitalism, Socialism and hybrid models like China). Capitalism leads to greater focus on innovation and a self-perpetrating cycle of growth in income levels, wealth and quality of life, eventually culminating into overall improved country happiness scores as visible in studies. Socialism, on the other hand, leads to inefficient resource allocation and wealth inequality which is against its basic principle. However, the side-effects of capitalism cannot be ignored and thus hybrid development models could provide the desired output. The paper highlights various alternate growth models which are gaining prominence.


Key Analytical Conclusions

  • The Macro Synthesis : Profit-seeking operates as the primary catalyst for individual fulfillment, shared knowledge, and a rising velocity of global innovation. However, unchecked market mechanisms generate critical negative externalities (environmental degradation, systemic poverty, and labor exploitation).
  • The Policy Balance : The study concludes that absolute state-controlled socialism fundamentally distorts capital allocation, leading to severe resource wealth inequality that violates its own foundational principles.
  • Structural Hybridization : Long-term socioeconomic stability requires a dynamic, competitive market model paired with a transparent, resolute state regulatory framework that adjusts its focus based on a country's distinct stage of developmental evolution.

IB DIPLOMA PROGRAM ECONOMICS EXTENDED ESSAY (EE)

  • Title : Evaluating the Market Impact and Allocation Efficiency of Pradhan Mantri Awas Yojana (PMAY-U) in Mumbai
  • Academic Discipline : IBDP Higher Level Economics
  • Core Methodology : Fieldwork and empirical analysis evaluating the execution and effectiveness of the Prime Minister’s urban housing scheme within the Mumbai metropolitan region. Applied microeconomic theory to analyze supply-side subsidies, price ceilings, and structural market failures in public-private affordable housing developments. While secondary data captures improved delivery of housing units, primary surveys highlighted the scheme features responsible for lower occupancies and effectiveness of the scheme, especially in lowest income groups. It was mainly due to factors such as lack of awareness, credit disbursals and basic utilities access.

The winning formula for an NBA team

Deciphering the drivers and trends of an NBA Players

The pursuit of profit maximisation